
← Statistics and Probability from Scratch
Lesson
Lesson 1: Null and alternative hypotheses, α, and the p-value
State H0/H1, understand the significance level α, and interpret the p-value correctly.
Steps in testing a statistical hypothesis
From stating H0 to the conclusion
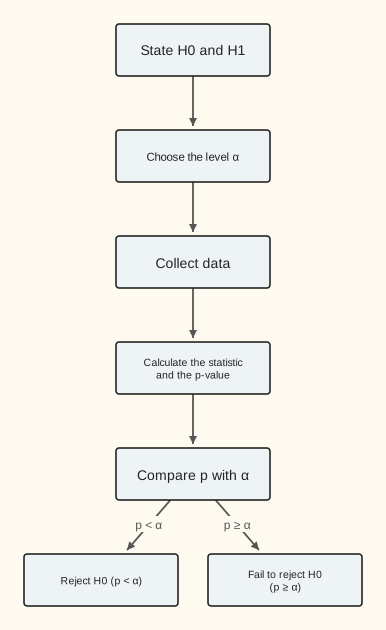
Hypothesis testing is a strict sequence of steps. The decision to reject H0 is made by comparing the p-value with the significance level α.
Lesson notes
Null and alternative hypotheses, α, and the p-value
Hypothesis testing is a formal procedure for making decisions based on data. We start with two statements: the null hypothesis H0 (“nothing is going on,” “there is no effect,” “the means are equal”) and the alternative hypothesis H1 (“there is an effect,” “the means differ”). The logic: we assume H0 is true, collect data, and see how compatible the data are with that assumption.
The significance level α is a threshold chosen in advance, usually 0.05 (5%). It means: if H0 is true, we're willing to wrongly reject it no more than 5% of the time. After the data are collected, the p-value is calculated. If p < α, we say “reject H0”; if p ≥ α, we say “fail to reject H0” (not the same as “accept H0”).
The correct interpretation of the p-value: it's the probability of getting data as extreme as, or more extreme than, the observed data, assuming H0 is true. For example, p = 0.03 means: “if there is no effect at all, the chance of seeing data this extreme or more extreme is 3%.”
The main trap: the p-value is NOT the probability that H0 is true. Saying “p = 0.04, so the probability that H0 is true is 4%” is a serious mistake. Also wrong: “p < 0.05 means we're 95% confident in H1.” Such statements confuse the conditional probability of the data (given that H0 is true) with the probability of the hypothesis itself.