
← Statistics and Probability from Scratch
Lesson
Lesson 3: The normal distribution, the 68–95–99.7 rule, and z-scores
Use the normal distribution and the 68–95–99.7 rule, and calculate a z-score to standardize a value.
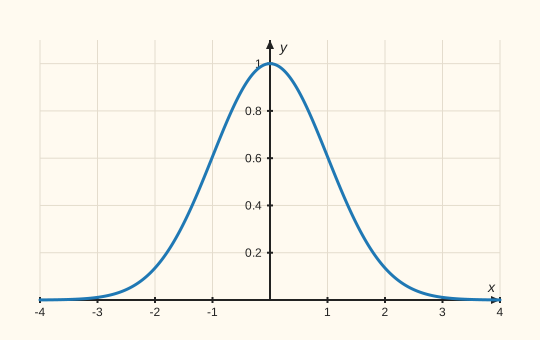
The bell-shaped curve of the normal distribution
The standard normal distribution N(0, 1)
The normal curve is symmetric about the mean (μ = 0), and the area under it equals 1. The 68–95–99.7 rule describes proportions of that area.
Lesson notes
The normal distribution and the z-score
The normal (Gaussian) distribution is the most important one in statistics. Its graph is a symmetric “bell.” Many real-world data sets are approximately normal: people's heights, measurement errors, test scores. A normal distribution is fully defined by two parameters: μ (the mean) and σ (the standard deviation).
The 68–95–99.7 rule tells you what proportion of observations falls in intervals around the mean: about 68% of values lie within 1σ of μ (that is, in the interval [μ − σ, μ + σ]); about 95% within 2σ; about 99.7% within 3σ. It's a powerful tool: you don't need to calculate integrals to estimate the proportion of data in an interval.
Example: IQ tests are standardized so that μ = 100 and σ = 15. Then 68% of people have an IQ from 85 to 115 (100 ± 15); 95% from 70 to 130 (100 ± 30); 99.7% from 55 to 145.
The z-score lets you standardize any value: z = (x − μ) / σ. It shows how many standard deviations the value x is from the mean. For example, x = 130, μ = 100, σ = 15: z = (130 − 100) / 15 = 30 / 15 = 2. The value 130 is 2 standard deviations above the mean. By the 95% rule, values with |z| > 2 occur in only ~5% of people.