
← Statistics and Probability from Scratch
Lesson
Lesson 1: Outcomes, events, and probability from 0 to 1
Define the sample space and an event, and calculate P(A) as the proportion of favorable outcomes, a number from 0 to 1.
The probability scale
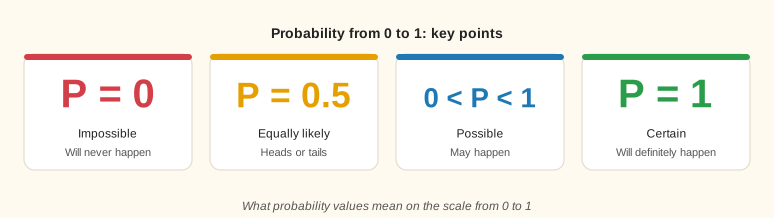
Probability from 0 to 1: key points
The probability of any event lies in the range from 0 (impossible) to 1 (certain). Most real-world events fall between these extremes.
Lesson notes
Sample space, events, and probability
When we roll a die, there are six possible results: 1, 2, 3, 4, 5, 6. Together, all these results form the sample space — the set of all possible outcomes of the experiment (for a fair die, all six are equally likely). An event is any subset of the sample space, that is, some specific condition that either happens or doesn't.
The probability of event A is written P(A) and is calculated with the formula: P(A) = (number of favorable outcomes) / (total number of outcomes). For example, the event “an even number comes up” is {2, 4, 6}, three favorable outcomes out of six, so P(even) = 3/6 = 1/2.
Probability always lies between 0 and 1: P(A) ∈ [0, 1]. P(A) = 0 means an impossible event; P(A) = 1 means a certain one. For a coin, P(heads) = 1/2, P(tails) = 1/2.
The complement rule: the event “not A” (the complement of A) has probability P(not A) = 1 − P(A). For example, P(not 6 on a die) = 1 − 1/6 = 5/6. This is handy when it's easier to count “not A” than A directly.