
Distinguish discrete from continuous random variables and calculate the expected value of a discrete random variable.
Distribution of a discrete random variable
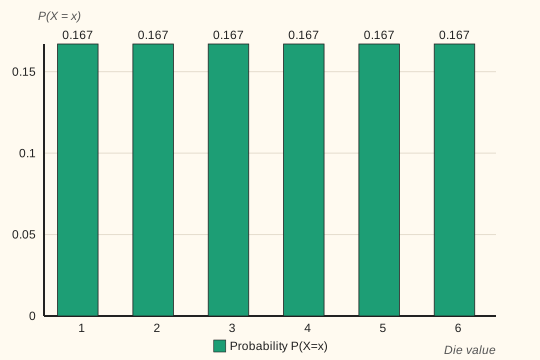
Distribution of the number rolled on a die
Each value on the die is equally likely (P = 1/6 ≈ 0.167). The expected value E[X] = 3.5 is the “long-run average.”
Lesson notes
Random variables and expected value
A random variable is a numerical outcome of a random experiment. For example, the number rolled on a die, the height of a randomly chosen student, or the wait time for a bus. We denote random variables with capital letters: X, Y, Z.
Random variables come in two kinds. Discrete ones take a finite or countable set of values: the number of heads in coin tosses, the number of customers in line. Continuous ones can take any value in some interval: a person's exact height, the exact wait time. In this lesson we focus on discrete ones.
The expected value E(X) is the “long-run average”: if you repeat the experiment many, many times, the average value of the random variable approaches E(X). Formula: E(X) = Σ x · p(x), that is, multiply each possible value by its probability and add up all the products.
Example: roll a fair die. Values: 1, 2, 3, 4, 5, 6 — each with probability 1/6. E(X) = 1·(1/6) + 2·(1/6) + 3·(1/6) + 4·(1/6) + 5·(1/6) + 6·(1/6) = 21/6 = 3.5. A die never shows 3.5, but this number is exactly the long-run average. Imagine a game: a roll of 1 wins you $1, a roll of 2 wins $2, and so on. Then E(X) = $3.50 — your average winnings per roll in the long run.