
← Statistics and Probability from Scratch
Lesson
Lesson 2: Spread — range, variance, standard deviation, IQR
Calculate the range, variance, and standard deviation, find the quartiles and the IQR, and understand what each measure says about spread.
Measures of spread compared
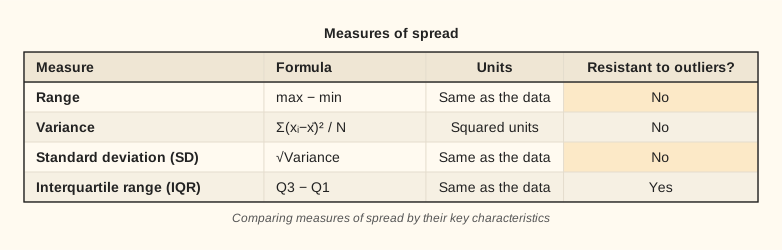
Four measures of spread: formulas and properties
Different measures of spread measure the same thing in different ways. Which one to use depends on the task and whether there are outliers.
Lesson notes
How to measure the spread of data
Knowing the mean is only half the story. You also need to know how widely the data are spread around the center: two groups can have the same mean but very different spread.
The range is the simplest measure: maximum minus minimum. For [2, 4, 4, 4, 5, 5, 7, 9]: range = 9 − 2 = 7. It's easy to calculate, but it depends only on the two extreme points and is very sensitive to outliers.
The variance takes every point into account. Steps: 1) find the mean; 2) subtract it from each value and square; 3) add up the squared deviations; 4) divide by the number of values (here N, the whole population). For [2, 4, 4, 4, 5, 5, 7, 9], mean = 5. Squared deviations: (2−5)²=9, (4−5)²=1, (4−5)²=1, (4−5)²=1, (5−5)²=0, (5−5)²=0, (7−5)²=4, (9−5)²=16. Sum = 32. Variance = 32 / 8 = 4. Standard deviation (SD) = √variance = √4 = 2. SD is in the same units as the data — its main advantage.
Quartiles and the IQR. Q1 is the median of the lower half of the data (the 25th percentile), Q3 the median of the upper half (the 75th percentile). The interquartile range IQR = Q3 − Q1 describes the spread of the “middle” 50% of the data. For [2, 4, 4, 4, 5, 5, 7, 9]: lower half [2, 4, 4, 4] → Q1 = (4+4)/2 = 4; upper half [5, 5, 7, 9] → Q3 = (5+7)/2 = 6; IQR = 6 − 4 = 2. Like the median, the IQR is resistant to outliers.