
Build and compare internally consistent scenarios (base/upside/downside) by changing several assumptions at once.
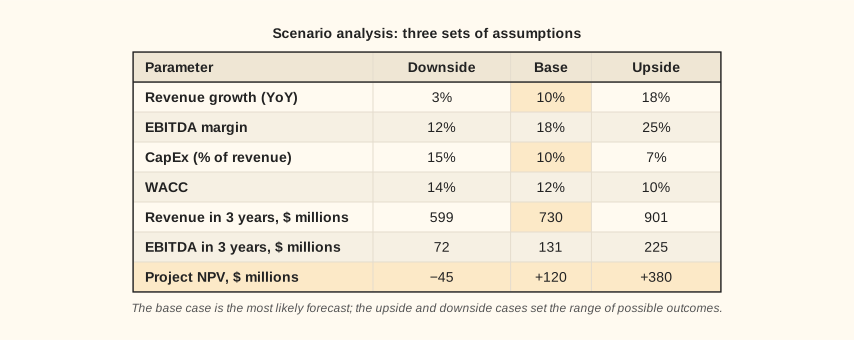
Three scenarios of a financial model: assumptions and results
Base, upside, and downside — three internally consistent sets of assumptions
Unlike sensitivity analysis, a scenario changes several assumptions at once, reflecting a coherent picture of the future.
Lesson notes
Scenarios vs. sensitivity: the difference, and how to build scenarios
The key difference: sensitivity analysis changes one input and holds all the others constant. A scenario changes several inputs at once, consistently — it paints a coherent picture of a possible future. For example, in the upside case, revenue, margin, and the growth rate all rise while the discount rate falls — an internally connected story, not just “a slightly lower rate.”
The three classic scenarios: the Base Case — the analyst's best honest estimate, neither optimism nor insurance against criticism; the upside case (Upside, or Bull) — everything goes better than expected but is still realistic; the downside case (Downside, or Bear) — the main risks materialize. Important: the base case is not the “arithmetic average” of the upside and downside cases but an independent, honest estimate.
In Excel, Scenario Manager (Data → What-If Analysis → Scenario Manager) lets you save several sets of input-cell values under different names and switch between them. Click Summary to produce a summary table of all the scenarios side by side — handy for presentations.
Scenario analysis helps you make a decision and mark out the range of risk: if the project stays profitable even in the downside case, that's a strong argument for investing; if the base case barely pays off, that's a signal for caution.