
← Statistics and Probability from Scratch
Lesson
Lesson 1: Mean, median, and mode — and when to use which
Calculate the mean, median, and mode of a small data set and choose a measure deliberately, understanding how sensitive the mean is to outliers.
Three measures of center
Mean, median, and mode — what's the difference
Each of the three measures answers its own question about the “typical” value. Which one to use depends on the shape of the distribution and whether there are outliers.
Lesson notes
Three measures of center: mean, median, mode
When we have a set of numbers, we want a single number that describes the “typical” value. That's what measures of center are for.
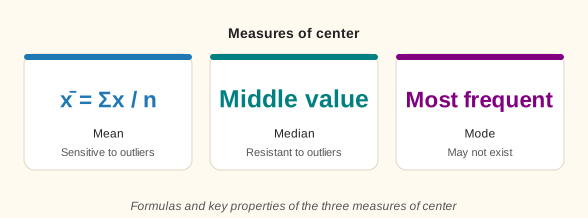
The mean is the sum of all values divided by their count. For the data set [2, 4, 4, 4, 5, 5, 7, 9]: sum = 40, count = 8, mean = 40 / 8 = 5. The median is the value exactly in the middle of the sorted data. With an even number of values, take the mean of the two middle ones. For the same set [2, 4, 4, 4, 5, 5, 7, 9], the middle values are 4 and 5, so median = (4 + 5) / 2 = 4.5. The mode is the value that occurs most often. In our set, 4 appears 3 times — that's the mode.
Why does this matter? Different measures behave differently when there are outliers — unusually large or small values. Consider the salaries at a small company: [20, 22, 24, 25, 26, 28, 300] (in thousands of dollars). Sum = 445, mean ≈ $63.6K. But the median is $25K — it sits exactly in the middle of the sorted data. The $300K salary, an outlier, “pulled” the mean up to about 2.5 times the median.
How to choose: if the data are symmetric with no outliers, the mean is informative. If the data are skewed or have outliers (salaries, home prices, incomes), the median reflects the “typical” value more honestly. The mode is used for categorical data (for example, the most popular shoe size) or when frequency is what matters.