
Build a sensitivity analysis with data tables (one and two variables) to see how the result depends on a key assumption.
A two-variable NPV sensitivity table
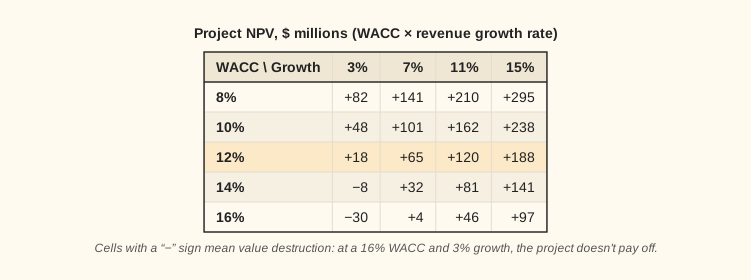
Project NPV at different discount rates and revenue growth rates
An Excel data table calculates the model's result for every combination of two variables in one step — without changing formulas by hand.
Lesson notes
What sensitivity analysis and data tables are
Sensitivity analysis answers the question “what happens if one of the assumptions changes?” Say you've calculated a project's NPV at a 10% discount rate. What happens to NPV if the rate rises to 12% or falls to 8%? That's exactly what a data table shows: it automatically recalculates the result for a whole range of values.
A one-variable data table lets you change one input (say, the rate or the growth rate) and see how one or more outputs change. You list the variable's values in a column (or row), point to the input cell, and Excel plugs in each value and records the result. The path in Excel: Data → What-If Analysis → Data Table.
A two-variable data table extends the idea: the rows hold the values of the first variable, the columns the second, and the result sits at each intersection. For example, rows = discount rate (8%, 10%, 12%), columns = revenue growth rate (3%, 5%, 7%), NPV in the cells. That gives you a grid of 9 scenarios in a couple of clicks.
A rule of thumb: run sensitivity on the variables with the most uncertainty and the biggest impact on the result. Most often, these are the discount rate, the growth rate, and the margin. Reading the table, an analyst sees at which values the project stays worthwhile (NPV > 0) and at which it doesn't.